Method of Data Analysis
Descriptive Statistics Method of Data Analysis
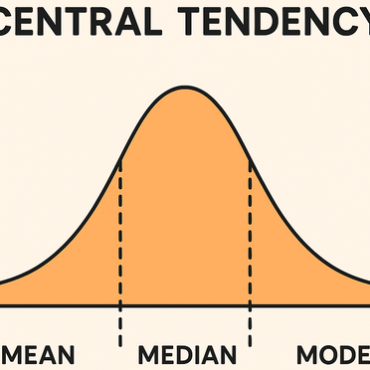
The term descriptive statistics is used to denote the method of data analysis that aid in defining and giving data summary in such a way that is meaningful such that elements like patterns may emerge from out of them. They provide summaries about the chosen sample and the various measures and together with graphic analysis that are simple, they are used fundamentally for nearly any analysis of quantitative data. The descriptive statistics are of two general types. Writers who offer mathematics assignment help at Edudorm essay writing service notes that the first one is the central tendency measures, which refers to ways of describing the central position of a group’s data frequency distribution (Nejati, 2013). Frequency distribution in this case connotes the pattern and distribution of data in marks scale from lowest score to the highest. The second type is the spread’s measure which refers to various ways of summarizing method of data analysis through a description of how spread out the scores appear. Various statistics are used to describe the spread which includes the quartiles, range, absolute deviation, standard deviation and variance (Nejati, 2013). Standard deviation would be the best suited descriptive statistical method in ensuring that all bottles are within quantity limit. It involves calculation of mean and then the standard deviation, which are used to set the control limits of the ketchup quality in a bottle. This will ensure that any measurement error is detected at a high rate with a low rate of false rejection.
Frequency tables
Frequency tables refers to tables that shows the distribution of data such that it represents the frequency of various outcomes in a chosen sample. Every entry into the table consist of the count or frequency of occurrences of given values within a certain interval or group. In this manner the tables provides summaries of value distribution in the sample (Sinha, Saxena & Gupta, 2015). The frequency distribution represents method of data analysis in grouping which is separated into classes that are mutually exclusive and how many times the occurrences in a class appear. Frequency distributions are used in both quantitative and qualitative data representation in graphs (Sinha, Saxena & Gupta, 2015). Experts who offer arithmetic assignment help at Edudorm essay writing service indicates that the frequency tables and the probability analysis can be useful in determining the frequency of an error occurring in the measuring process, and provide a visual representation of data about products quality in the line of production. These techniques are very helpful in production line inspection and sorting out of products in order to rectify the ones that are faulty. The methods process would thus be useful in detecting where errors are occurring in a process and the frequency with which such errors are happening.
Correlation and regression Method of Data Analysis
Correlation and regression refers to method of data analysis used to show the relationship between variables. Regression method of data analysis consist of the identification of the how a dependent variable relates to one or more variables that are independent (Wegner, 2007). It also involves the application of various tests to show whether the model used in determining this relationship is satisfactory. If the model used is considered satisfactory, the regression equation that is estimated is can used in predicting the dependent valuable values given the independent valuable values. Correlation involves the use of a coefficient, which shows the extent of relationship between the two variables. The values of this coefficient is at all times between -1 and +1. None of these techniques can be used to show the cause –effect relationship (Wegner, 2007). Authors who offer trigonometry assignment help at Edudorm essay writing service points that the cause-effect relationship are based on the analyst’s judgement. In our case, the method of data analysis could be used to show the extent of the relationship between the ketchup quantity in and the production line where the bottles are filled. This would be used to show in which production line the error is occurring so that any rectification can be done. The other variable is thus the production line.
Time Series Method of Data Analysis
Time series analysis involves method of data analysis collected in time series so as to obtain meaningful statistics of the data. Time series can be defined as a group of observations that are quantitative and which are spaced evenly in time and successively measured. Tutors who do my math homework at Edudorm essay writing service acknowledges that it is used in pattern in data that is correlated and predicting trends from the patterns, and deviation of a certain size to show a problem (Shumway & Stoffer, 2011). Thus this method of data analysis can be used to predict the pattern of default bottles quantities being produced and show the deviation in specified quantity – 14- oz – and the observation of the pattern to eliminate error in the process.
Conclusion
The standard deviation method would be the most helpful method of data analysis in ensuring that the amount of ketchup in the bottles stays within the set limit. The method of data analysis will allow the monitoring of the product so as to it meet the set specifications by indicating any deviation from the specifications targeted and any excessive variability around those specifications.
References
Nejati, M. (2013). Frontiers of business, management and economics: An Interdisciplinary collection of managerial research findings and breakthroughs.
Shumway, R. H., & Stoffer, D. S. (2011). Time series analysis and its applications: With R examples. New York: Springer.173
Wegner, T. (2007). Applied business statistics: Methods and Excel-based applications. Cape Town: Juta. 406-408
Sinha, V., Dr. Saxena, J. & Gupta, A. (2015). Business Statistics: Commerce eBook. SBPD Publications.51